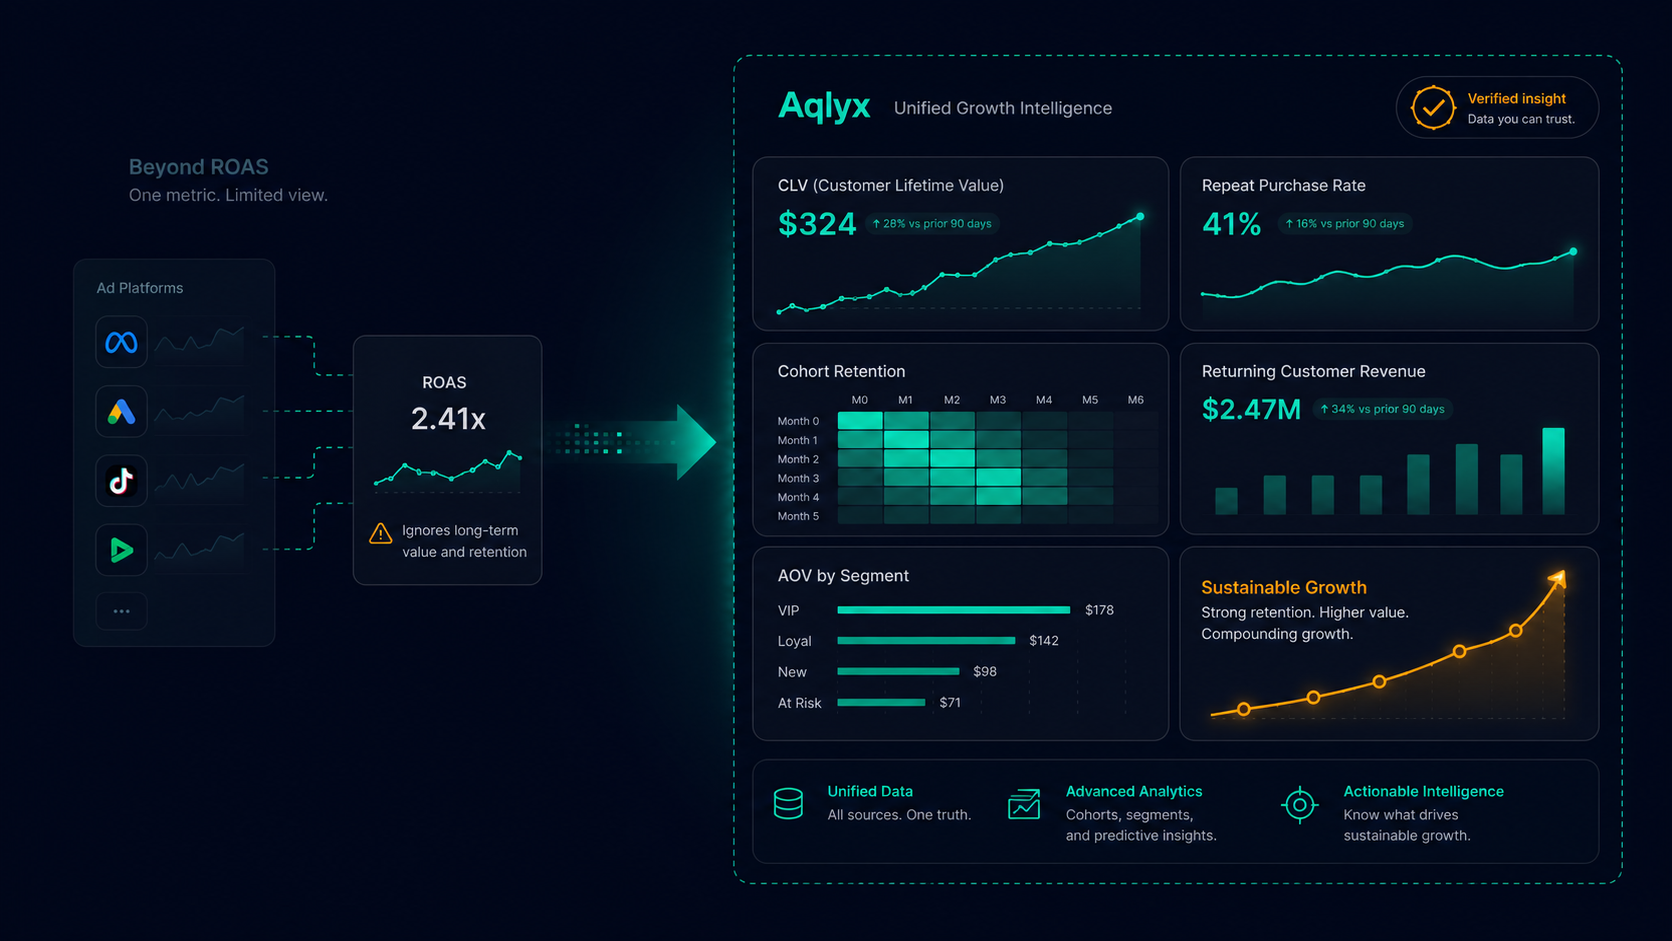
Every e-commerce team checks ROAS. It sits at the top of the Meta Ads dashboard, refreshes in real time, and feels like the clearest signal of whether marketing is working. A 4x return feels good. A 2x return triggers a call with the agency.
The problem is not that ROAS is wrong. The problem is what it does not tell you. ROAS measures revenue attributed to an ad click divided by what you spent on that click. It says nothing about whether the customer who clicked came back. Nothing about whether the margin on that order was healthy. Nothing about whether you are building a business or just renting customers one campaign at a time.
Brands that optimise exclusively for ROAS tend to look strong in the ad dashboard and fragile everywhere else. They acquire customers cheaply on the first order, then watch them disappear. They scale spend to hit a ROAS target without noticing that average order value is declining or that their best customers stopped reordering six months ago.
Sustainable growth requires a different set of questions. Here are the metrics that actually answer them.
Customer Lifetime Value
CLV is the total revenue a customer generates across their entire relationship with your brand. It is the single most important number in e-commerce and the one most brands cannot tell you off the top of their head.
When you know CLV, ROAS becomes interpretable. A campaign with a 3x ROAS acquiring customers who spend on average three times over two years is far more valuable than a 5x ROAS campaign that acquires one-time buyers. The ad dashboard cannot show you this. Only a view that connects the ad click to everything that happened after it can.
CLV also tells you how much you can afford to spend to acquire a customer. If your average CLV is $450 and your target payback period is 12 months, you know your ceiling on customer acquisition cost. Without CLV, CAC targets are guesses.
Repeat Purchase Rate
What percentage of your customers place a second order? This single number reveals more about product-market fit and brand loyalty than any ad metric.
Most e-commerce stores have a repeat purchase rate between 20 and 40 percent. Brands with strong repeat rates above 50 percent tend to have lower acquisition costs because word of mouth does more work, and their unit economics improve with scale rather than deteriorating.
The follow-up question is equally important: how long does a second order typically take? If the median gap between first and second order is 45 days, and a customer has not returned in 90 days, that is an at-risk customer worth targeting with a retention campaign before they are gone for good.
Cohort Retention
Rather than looking at all customers as one pool, cohort analysis groups customers by when they first purchased and tracks their behaviour over time. It answers the question your aggregate metrics cannot: are the customers we acquired this year more or less loyal than the ones we acquired last year?
A business with declining cohort retention is quietly losing ground even if total revenue is growing, because the growth is masking higher churn from older cohorts. A business with improving cohort retention is compounding. Each new cohort of customers retains better than the last, which means growth gets cheaper over time rather than more expensive.
New vs Returning Customer Revenue Split
How much of your monthly revenue comes from customers who have bought before versus first-time buyers? This ratio tells you whether you are growing through acquisition, retention, or both.
A brand that is 90 percent dependent on new customer revenue is one bad ad quarter away from a serious problem. A brand where 40 to 50 percent of revenue comes from returning customers has a baseline that survives disruption in the ad market, algorithm changes, and rising CPMs.
This is also the metric that makes the case internally for investing in retention. When you can show that a returning customer has three times the order value and zero acquisition cost, the argument for a loyalty programme or post-purchase email flow writes itself.
Average Order Value by Customer Segment
Blended AOV is a starting point, not a conclusion. The more useful question is how AOV differs across customer segments. Do high-CLV customers have higher AOV on their first order, or do they start small and grow? Do customers acquired through certain channels consistently spend more?
Understanding AOV by segment lets you design acquisition campaigns that attract the right customers, not just the most customers. It also informs merchandising decisions: if your top CLV customers consistently include a certain product category in their first order, that category deserves prime placement.
Putting It Together
None of these metrics replaces ROAS. ROAS is a useful operational signal for the ad account. But it answers a narrow question about what happened inside one platform on one day. The metrics above answer the broader question of whether the business is compounding.
The reason most e-commerce brands do not track them consistently is not that they do not want to. It is that pulling these numbers requires joining data across Shopify, the ad platforms, and often a spreadsheet or two, and doing it manually every month takes hours that most teams do not have.
This is exactly the problem Aqlyx is built to solve. It connects your Shopify store, Meta Ads, Google Ads, and GA4 data into a unified layer and lets you ask questions in plain English. You do not need to build a cohort analysis in a spreadsheet. You do not need a data analyst on payroll.
“What is our repeat purchase rate this year compared to last year, and which customer segments are driving the difference?”
That is a question Aqlyx answers in seconds, with the data sourced directly from your store and cited so you can verify it.
ROAS will always have a place in your dashboard. But the brands that grow sustainably are the ones who know what happens after the click.