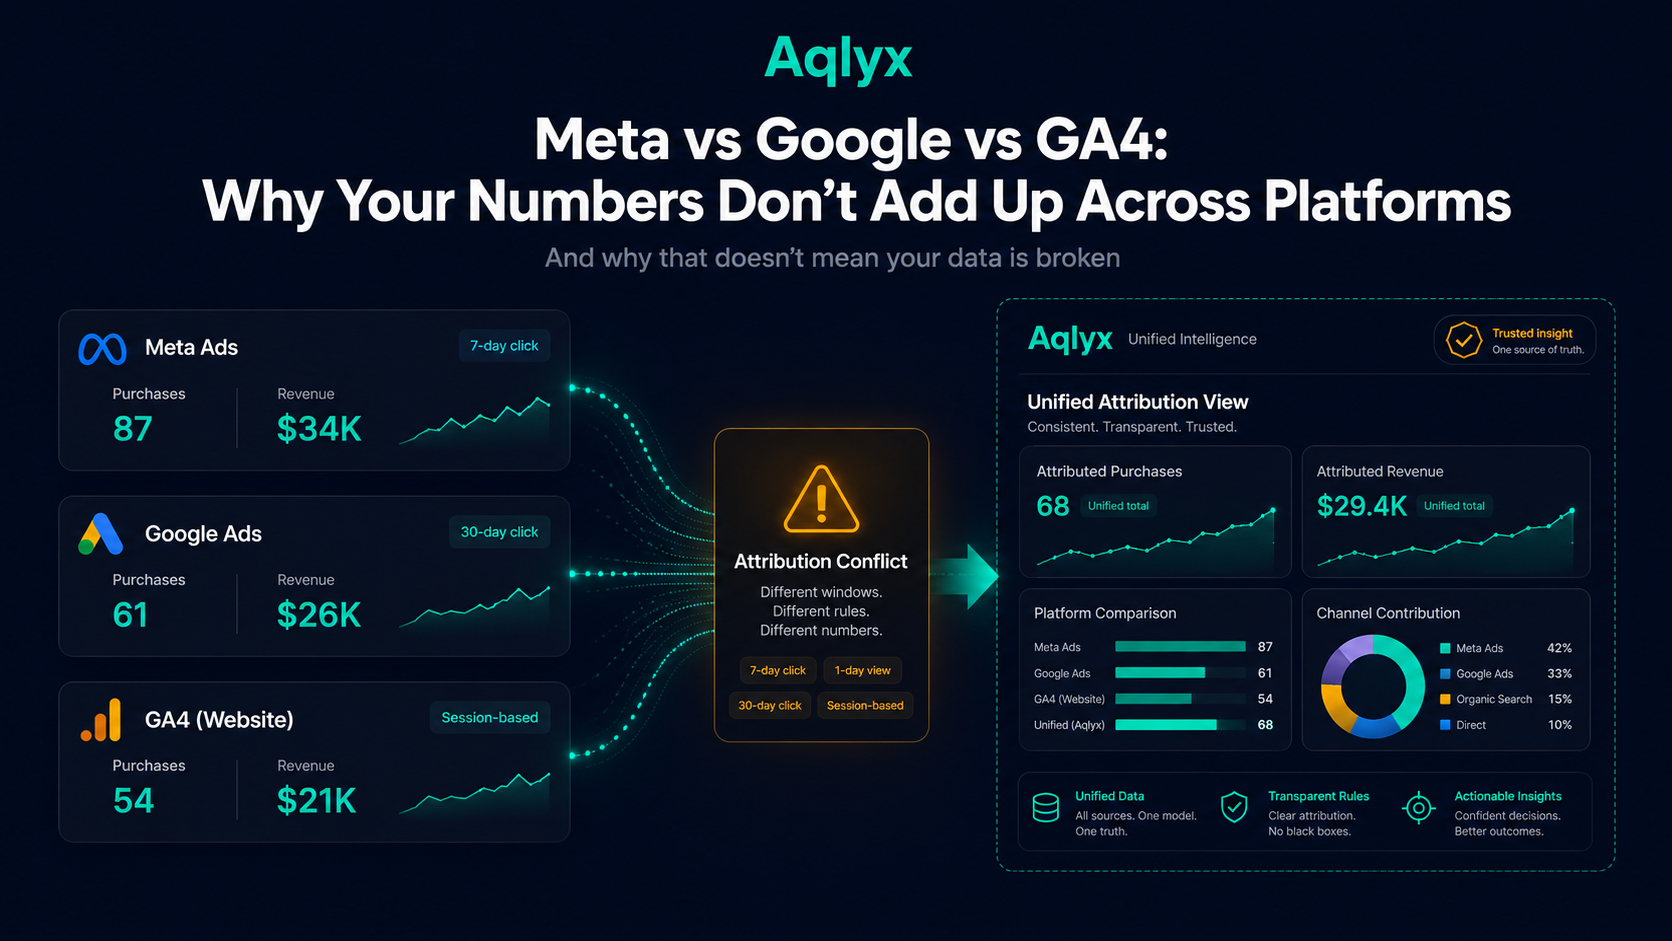
You spend $10,000 on Meta ads this month. Meta's dashboard shows 87 purchases and $34,000 in revenue. You open Google Analytics and it says 61 purchases. Your Shopify backend shows 54. Three tools, three different numbers, one very confused marketing team.
If this is your Monday morning, you're not alone. This is one of the most common frustrations in modern marketing, and it has a name: attribution conflict. The good news is it's not a bug. The bad news is it's not going away. The real news is that once you understand why it happens, you can stop arguing with the numbers and start using them properly.
The Core Problem: Every Platform Thinks It Deserves the Credit
When a customer buys from you, they rarely do it in one straight line. They might see your Instagram ad on Tuesday, Google your brand name on Thursday, click a Google Ad on Friday, and finally buy on Saturday after typing your URL directly.
So who gets credit for that sale?
- Meta says: “They saw our ad on Tuesday. We get credit.”
- Google Ads says: “They clicked our ad on Friday. We get credit.”
- GA4 says: “They came in directly on Saturday. We get credit.”
All three are correct. And all three are wrong. This is the attribution problem, and it is the root cause of almost every number mismatch you will ever see.
Reason 1: Attribution Windows Are Not the Same
Each platform has a default window, the time period it looks back to claim credit for a conversion.
| Platform | Default Click Window | Default View Window |
|---|---|---|
| Meta Ads | 7 days after click | 1 day after view |
| Google Ads | 30 days (search and display) | None by default |
| GA4 | Session-based (same visit) | N/A |
Meta's view-through attribution is the biggest culprit. If someone simply saw your ad, did not click, just scrolled past it, and bought something within 24 hours, Meta counts that as a conversion it drove. GA4 will never count that, because GA4 only tracks what happens on your website. The result: Meta almost always reports more conversions than any other tool.
Business implication: Meta's numbers are not inflated. They are measuring something different. A view-through conversion is real signal, but it is softer than a click-through. When comparing platforms, compare click-through conversions only, and set a consistent attribution window across all platforms (7-day click is a reasonable standard).
Reason 2: GA4 Lives on Your Website. Meta and Google Live in Their Own Ecosystems.
This is the most important structural difference and the one least understood.
GA4 only knows what happens on your website. It tracks sessions, page views, events, and purchases, but only the ones that have a traceable UTM source. If a user clicks your Meta ad but their phone blocks cookies (hello, iOS 14), GA4 may record that visit as “direct” or “organic” because the tracking parameter got stripped. The sale happens, GA4 sees it, but the source is lost.
Meta's Conversions API (CAPI) and pixel operate partly server-side. Meta can match a conversion back to an ad impression using its own logged-in user data, even when the browser cookie is blocked. This is why Meta often reports more conversions than GA4 shows from the meta/paid-social source.
In plain English: GA4 sees the purchase but loses the referral. Meta sees the purchase and correctly attributes it back to itself. Same purchase, counted differently.
Reason 3: How “Revenue” Is Calculated Differs
Even when all three platforms agree a conversion happened, they may report different revenue figures.
- Shopify reports what was actually paid, after discounts, including or excluding tax depending on your settings.
- Meta reports the value parameter sent to its pixel at the moment of purchase. If your pixel fires before the order is confirmed, or uses a different value (subtotal vs total), the number drifts.
- Google Ads reports the conversion value from its tag, same risk of firing at the wrong moment or with the wrong value.
- GA4 reports the purchase event value from your GTM setup or native integration, which again depends on how it is implemented.
A $5 shipping fee, a 10% discount code, or a currency conversion can all create legitimate differences between what each platform reports.
Reason 4: Time Zones and Reporting Windows
A small but real contributor. Meta defaults to the time zone of your ad account. Google Ads uses your account time zone. GA4 uses your property time zone. If these do not match, a sale that happens at 11 PM in Istanbul might appear in different calendar days depending on which tool you are looking at.
So What Should You Actually Do?
1. Pick one source of truth for revenue.
Your Shopify (or e-commerce backend) is the only system that knows exactly what was purchased and for how much. Use it as your revenue benchmark. Never use Meta or Google Ads revenue numbers as your primary business KPI.
2. Use each platform's numbers for what they are good at.
Meta's dashboard is best for understanding creative performance, audience reach, and cost per result within Meta's ecosystem. Google Ads is best for keyword-level efficiency and search intent. GA4 is best for understanding on-site behavior, funnels, and which channels drive engaged sessions, not for attributing paid conversions.
3. Compare ROAS directionally, not absolutely.
If Meta's ROAS is 3.2x and Google's is 2.1x, the conclusion is “Meta is relatively stronger than Google this month.” The exact numbers are less meaningful than the trend and the comparison between channels within the same measurement system.
4. Move toward unified attribution.
Tools like GA4's data-driven attribution model, or a dedicated analytics layer that reads from all sources simultaneously, give you a more honest picture. The goal is not one perfect number. It is a consistent framework you apply every month so you can measure change over time.
The Bottom Line
The reason your numbers do not add up is not because your tracking is broken. It is because Meta, Google, and GA4 were each built to make their own channel look as valuable as possible, using different definitions, different windows, and different data sources.
Understanding this does not just reduce your frustration. It makes you a sharper marketer. When you know that Meta's view-through window inflates its numbers, you can discount that appropriately and still use it to compare creatives. When you know that GA4 undercounts paid social due to iOS privacy changes, you know to look at Meta's CAPI numbers as a supplement, not a contradiction.
The platforms are not lying to you. They are each telling their own version of the story. Your job, and the job of good analytics, is to understand all of them at once.